What Belongs on a CISO Dashboard, and What Doesn’t

Table of contents
Boards don’t fund severity scores. Learn which metrics earn a place on a CISO dashboard, which ones quietly damage credibility, and what should never leave the security team.
Key takeaways
- A CISO dashboard is a decision tool for the board, not a report on the security team’s activity.
- Metrics without a business impact, like raw CVSS counts or phishing click rates, cost credibility instead of earning it.
- Exposure outside the perimeter (leaked credentials, supplier incidents, impersonation) belongs on the dashboard, because that is where most breaches now start.
- Some data should never reach a board pack. Show the trend and the impact, not the raw leak.
Every CISO eventually builds a dashboard for the board. Most start with what the security team already measures: vulnerabilities found, alerts closed, phishing tests passed.
That’s understandable. It isn’t what the board needs.
A board doesn’t need to know how busy the security team is. It needs to know what is exposed, what it would cost, and whether it’s getting better. A good CISO dashboard answers those three questions on one page, in a language the CFO can compare against everything else competing for the same budget.
The rest of this article covers what that looks like in practice, drawing on the cyber leaders interviewed for The Essential CISO Primer, third edition.
Severity is not a business language
The most common board metric is also the weakest. Vulnerability counts and CVSS scores still fill board decks, as if a severity rating explained what is at stake.
Kayne McGladrey, author of the GRC Maturity Model, puts it bluntly in the primer: “no director has ever allocated capital against a decimal point.” A CVSS 9.2 goes nowhere. A patch that protects a process generating $200,000 an hour gets discussed and funded. Until a metric carries a figure a CFO can compare, he argues, it is a vanity stat that damages the CISO’s credibility.
The same logic applies to the metrics security teams are most proud of.
| Common metric | Why it misleads | Board-ready alternative |
|---|---|---|
| Number of critical vulnerabilities | Severity without business context | Revenue or operations at risk from unpatched critical systems |
| Phishing simulation click rate | Measures a busy Tuesday, not resilience | Time for the first report to reach the SOC, and how many people report after it |
| DLP alerts per day | Volume without value | Confirmed incidents involving classified data |
| Supplier incidents notified | Only counts what suppliers chose to confirm | Incidents claimed publicly against key suppliers versus incidents confirmed |
| Leaked credentials found | A large number with no priority | Valid credentials exposed for privileged or non-human accounts, and time to revoke |
The phishing row comes straight from experience. Christophe Mazzola ran click-rate simulations for years and watched the number improve while “nothing underneath it changed.” He now measures how long it takes for the first report to reach the SOC. That number, he says, “you can act on.”
Research backs him up. An eight-month trial at UC San Diego Health, covering more than 19,500 employees, found trained users failed only 1.7% less often than untrained ones.
A dashboard full of activity metrics tells the board the team is working. A dashboard of decision metrics tells the board where to spend.
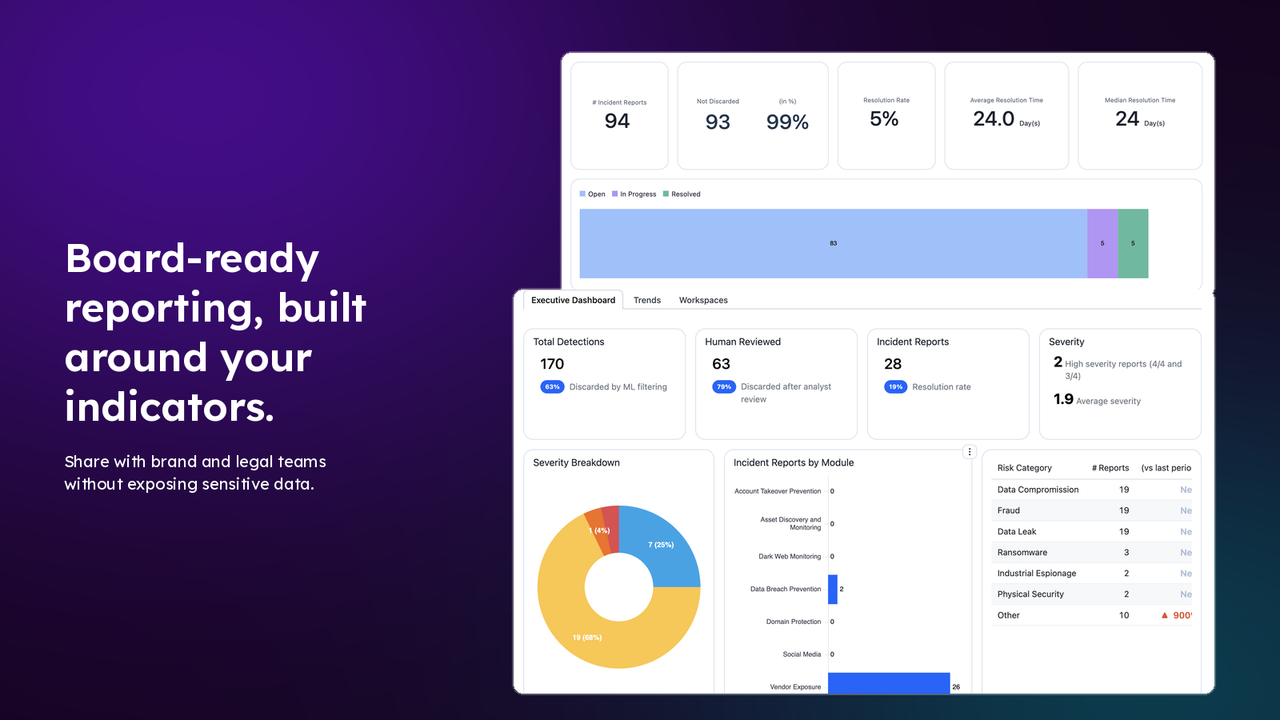
Measure exposure outside the perimeter
Most CISO dashboards look inward: patch levels, endpoint coverage, training completion. Those still matter. But a growing share of breaches start in places the security stack can’t see.
The evidence in the primer is consistent:
- Verizon’s 2026 Data Breach Investigations Report finds stolen credentials in 39% of breaches once the whole attack chain is counted.
- OWASP’s Non-Human Identities Top 10 points to 24 million exposed non-human identity credentials on GitHub in 2025. Around 70% of those dating from 2022 were still valid.
- The World Economic Forum’s Global Cybersecurity Outlook 2026 ranks third-party and supply chain risk as the biggest barrier to cyber resilience.
Suppliers are a blind spot even for well-run teams. Loïc Jardin, CybelAngel’s CISO, counted about ten supplier incident notifications this year. Over the same period, threat actors publicly claimed around 80 attacks against 12 of the SaaS vendors his team relies on.
That gap is a metric in itself. So are these:
- Exposed credentials: valid corporate and non-human credentials found in leaks or infostealer logs, and median time to revoke.
- Supplier exposure: public claims against critical suppliers, and how many were confirmed or dismissed.
- Brand impersonation: lookalike domains and fake profiles detected, and median time to takedown.
- Exposed assets: internet-facing systems or data the organization didn’t know it had.
Each one answers a question a director might actually ask: are we exposed right now, and how fast do we close it?
What should stay off the dashboard
A board dashboard travels. It gets forwarded to the executive committee, pasted into board packs, shared with legal and brand teams. Every copy is another place sensitive data can leak from.
That is why some things should never appear on it:
- Raw credential samples, even partially masked.
- Screenshots from dark web forums or leak sites.
- Names of individual employees whose accounts were exposed.
- Unverified threat actor claims presented as fact.
None of these help a director make a decision. All of them create risk if the deck travels further than planned.
What the board needs is the shape of the problem: how many valid credentials are exposed this quarter compared with last, which business units they belong to, how quickly they were revoked. The detail stays with the team that acts on it.
A good dashboard shows the trend and the impact. The evidence lives one level down, with the people who need it.
Questions to ask before your next board meeting
Before you build or rebuild the dashboard, test each metric against a few simple questions:
- Can a director act on this number, or only admire it?
- Does it carry a cost, a time or a business process the CFO recognizes?
- Does it show change over time, not just a snapshot?
- Does it cover exposure outside the perimeter, including suppliers?
- Could this page be forwarded safely to someone outside the security team?
- Would the board notice if this metric disappeared?
If the answer to the last question is no, the metric probably belongs in an operational report, not in front of the board.
Frequently asked questions
A small set of metrics a board can act on: the business impact of open risks, exposure outside the perimeter (leaked credentials, supplier incidents, impersonation), how fast the team closes that exposure, and how each figure is changing over time. Keep it to one page.
Metrics tied to cost, time or business processes. For example: revenue at risk from unpatched critical systems, valid privileged credentials exposed and time to revoke, and time for a phishing report to reach the SOC. Avoid raw vulnerability counts and CVSS scores on their own.
They measure how busy people were on the day of the test, not how resilient the organization is. A UC San Diego Health trial of more than 19,500 employees found trained users failed only 1.7% less often than untrained ones. Reporting speed is a more useful measure.
The trend should, the raw data shouldn’t. Show how much exposure exists, where it sits and how fast it is closed. Credential samples, screenshots and employee names stay with the security team.
The board view usually follows the board cycle, often quarterly. The metrics behind it should update continuously, so the CISO can answer questions between meetings.
A dashboard is an argument, not an inventory
The CISO dashboard is often the only part of security a board sees. It shapes how directors think about risk, and how much they trust the person presenting it.
A dashboard full of activity proves the team is busy. A dashboard built on exposure, cost and time proves the team understands the business.
The question is no longer how much the security team can measure. It’s whether the board can make a decision from what it sees.
About the author