Measuring the ROI of Proactive Cybersecurity Solutions

Table of contents
How do you measure the value of a proactive solution? How do you place a value on an incident that hasn’t occurred? Being asked to do so can feel like a riddle. The answer is surprisingly simple: You measure the value or ROI of a proactive solution, just like any other product, by comparing the before and after.
Understanding the before
Many products have an easier time measuring their ROI than proactive solutions do. A faster, less wasteful printer has a clear expected outcome, such as 1000 more pages per hour, but with proactive solutions, there is a feeling of ambiguity. To cure that sense of ambiguity, it is vital that you understand and have measured the “before.”
What do we mean by “the before”?
The secret to understanding the “before” is having a clear idea of what is happening today. For companies, this means understanding the processes in place today and having metrics for both inputs, outputs, and outcomes. This data creates a baseline or a “before” picture for you to contrast against “after” or post-solution metrics. Keep in mind that metrics will vary by department and some may be subjective. The next step is to pick which metrics will act as the key performance indicators or KPI.
How to pick the right metrics and KPIs?
Choosing which metric and KPI to follow can make or break the ROI analysis of a proactive solution. Some metrics can be much simpler to track than costs, such as the number of security breaches/incidents seen in a year, or the rate insurance premiums change. Some metrics, such as ‘costs” can be more complicated. When measuring ROI the number one metric is usually cost, not just the payments for a system or service, but the costs currently being experienced by a company.
Cost is a small word for all the items that can be included under its umbrella. Labor hours, recruitment costs, loss of business, decrease in brand value, downtime, insurance, legal expenses, fines, and remediation are all common types of costs that can be measured to identify changes in the “before and after” stage. In cybersecurity, three common metrics or KPIs are: the number of breaches in a year, insurance premiums, and labor hours. Changes in these KPIs can be used to predict proactive solutions’ effectiveness, risk reduction, and efficiency.
Getting a clear picture of the “after”
Much of the work done to understand the ‘before” can be used again to determine how things have changed in the “after.” But when is “after”? Deciding on when to measure a solution’s effect is nearly as important as choosing which metrics will be used. Measure too early and even the most effective solutions won’t have had time to take effect, measure too late and ineffective solutions are left in place due to inertia. So when is the best time to get a clearer picture of the “after”?
Typically it’s best to measure a proactive solution’s effects one year, two years, and three years after adoption. While that may seem like a long time, it’s vital to remember that some solutions build upon their own success, adoption among a company can take time, and finally, there is a learning curve to nearly every solution. By measuring a proactive solution’s effects at multiple points, you give time for real full-use data to be collected revealing the success or failure of a solution.
Time to Measure Up
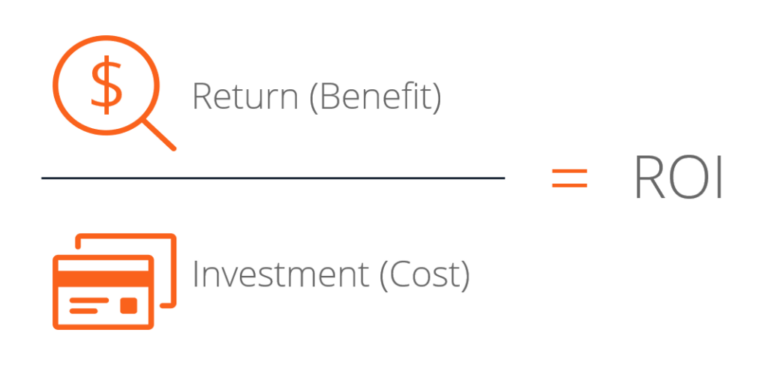
Once you have enough data for the “before and after” pictures, it’s time to do some math. Luckily the formula is pretty simple. The amount of ROI that your company collects is determined by the benefits received (return) divided by the investment or cost of a proactive solution:  In theory, the benefits are the positive changes seen in the metrics or KPIs in dollar form. Some metrics don’t map cleanly to an exact dollar amount. That is why the three KPIs of “number of breaches in a year,” insurance premiums, and labor hours can be so valuable as they can be mapped to a dollar amount. With that information, a real attributable ROI can be calculated and prescribed to a proactive solution.
See it in Action
Recently CybelAngel commissioned a Total Economic Impact (TEI) study by Forrester Consulting to determine the Return on Investment for customers using CybelAngel’s world-leading external risk protection platform.
The study reveals that a composite CybelAngel customer achieves a 359% return on investment over three years, reduces cyber insurance premiums by 10%, and avoids two major data breaches per year. To read the full TEI study or learn more about CybelAngel check out our dedicated blog.
