The 30 Best Cybersecurity Metrics to Track
Table of contents
Thirty metrics CISOs are commonly advised to track, and a harder question underneath all of them: which ones have ever actually changed a decision.
“If you have to forecast, forecast often.”
Edgar Fiedler
Most cybersecurity metrics programs grow by addition. A new framework arrives, a board member asks a pointed question, an audit flags a gap, and another KPI gets added to the dashboard. Few get removed. The result, in most organizations, is a long list of things being measured and a much shorter list of things that measurement has ever changed.
That gap is worth naming before adding to the list. The 30 metrics below are commonly recommended, and each has a legitimate use. But the recurring failure mode among CISOs isn’t tracking too few of them. It’s tracking metrics that are easy to generate and hard to act on, while the ones that actually move budget or board decisions go underused because they require more interpretation than a dashboard provides.
Two things worth going to directly if you want the strategic version of this rather than the full list: CybelAngel’s Attack Surface Management platform covers the operational side of a large share of what’s measured below, and the CISO Insights series covers the board and budget side in more depth than a metrics list can.
Use the list below as a menu, not a mandate. The goal is a small set of metrics your organization actually uses, not full coverage of everything on this page.
Jump to a specific metric:
- Breach likelihood
- Incident rate
- Cost per incident
- Risk exposure
- Severity level of breaches
- Percentage of assets in inventory within policy
- Percentage of privileged accounts managed within policy
- Percentage of high-risk patches implemented within policy timeframes
- Mean time to detect (MTTD) security incidents
- Mean time to contain (MTTC) security incidents
- Mean time to remediate/resolve incidents
- Percentage of data centralized
- Percentage of data encrypted
- Backup frequency and recovery speed
- Percentage of company data exposed on the dark web
- Number of unidentified devices on the network
- Number of devices with unpatched software
- Rate of true positives in security alerts
- Number of threats detected and prevented by endpoint solutions
- Results from penetration testing and red team exercises
- External security ratings compared to peers
- Compliance with regulatory requirements
- Application security testing scores
- Volume of actual incidents versus intrusion attempts
- Results from tabletop exercises and attack simulations
- Percentage of watchlisted (high-risk) users
- Level of employee security awareness
- Frequency of security awareness training
- Depth of network segmentation (e.g. IoT devices)
- Return on investment (ROI) for cybersecurity initiatives
- Bonus tip: the false positive trap
1: Breach likelihood
Breach likelihood estimates the probability of a security incident if current attack trends and existing controls remain unchanged. It’s a predictive metric, not a historical one, which is what makes it useful for budget conversations that are inherently about the future rather than the past.
A working calculation draws on three inputs:
- Total incident volume, both successful and failed breach attempts
- Third-party risk assessment scores
- User and Entity Behavior Analytics (UEBA) data
Predictive modeling against these inputs can estimate both the likelihood of a future breach and its probable cost, which is the number that actually lands in a board conversation.
2: Incident rate
The incident rate tracks the frequency and volume of security incidents over time. Reviewed on a rolling basis, it should show one of three trends: increasing, decreasing, or stable.
It’s a foundational metric for reviewing standard threat categories, malware infections, data breaches, and DDoS activity, and it’s the baseline most other metrics on this list are measured against.
3: Cost per incident
This is the metric that translates security work into terms a board and a CFO already understand.
IBM’s 2025 Cost of a Data Breach Report puts the global average at $4.44 million, down 9% from the year before, with breaches now taking an average of 241 days to identify and contain, the fastest detection time the report has recorded in nine years. Both figures moved in the organization’s favor last year, which is itself worth stating plainly to a board rather than only reporting cost when it rises.
4: Risk exposure
Risk exposure quantifies an organization’s potential losses across its threat landscape, typically calculated as Probability of Risk Occurring multiplied by Potential Loss or Impact. The output is meant to inform resource allocation decisions, not just describe risk in the abstract.
Risk exposure calculations are also central to M&A due diligence, where undisclosed exposure in a target company becomes the acquirer’s problem the day the deal closes. CybelAngel’s M&A Cyber Due Diligence service covers this specifically.
5: Severity level of breaches
Security teams commonly apply frameworks like the Common Vulnerability Scoring System (CVSS) to quantify the severity of vulnerabilities and incidents, generally reduced to four levels:
- Level 1: Low severity (minimal impact)
- Level 2: Medium severity (moderate impact)
- Level 3: High severity (significant harm)
- Level 4: Critical severity (catastrophic impact)
Reporting severity distribution over time, not just the count of incidents, gives a board a sense of whether the organization’s overall risk is concentrating or spreading out.
6: Percentage of assets in inventory within policy
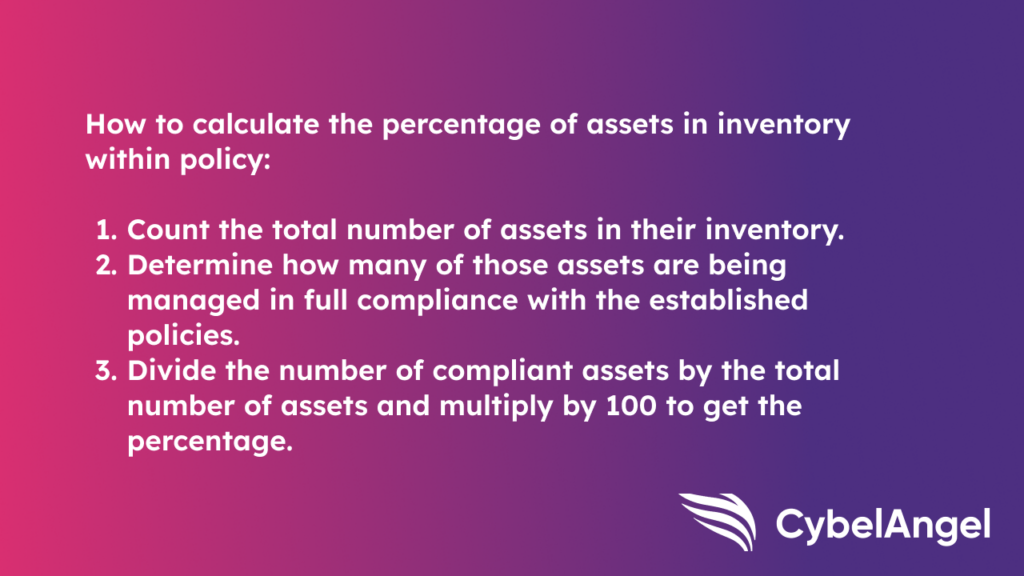
This metric records the share of company assets that are accounted for, actively managed, and maintained in line with organizational policy. It’s a direct read on the state of asset tracking, maintenance, and lifecycle management, and a low score here tends to explain gaps that show up elsewhere on this list.
7: Percentage of privileged accounts managed within policy
Privileged Access Management (PAM) programs require regular review to confirm that access to sensitive systems still meets policy standards, and that review should be automated rather than manual. Forrester’s assessment is direct on this point: manual, spreadsheet-based approaches to privileged access “are insecure, expensive, don’t scale, and can’t be sufficiently audited.”
The standard calculation:
(Number of privileged accounts within policy / Total number of privileged accounts) x 100
8: Percentage of high-risk patches implemented within policy timeframes
This KPI measures how effectively vulnerabilities are patched within your organization’s own defined policy window. It’s a direct reflection of patching cadence and, by extension, how quickly the organization closes known gaps once they’re public.
The metric matters most in the gap between disclosure and exploitation. The window between a vulnerability becoming public and an exploit appearing in the wild has continued to shrink industry-wide, which makes policy timeframes set even a year or two ago worth revisiting rather than assuming they still hold.
9: Mean time to detect (MTTD) security incidents
MTTD measures the average time between an incident occurring and its detection. A lower MTTD reflects more effective monitoring and faster intrusion detection.
Good to know: MTTD and MTTR are precise metrics that can read as opaque to a non-technical board. Define the calculation plainly when you present it, the time between when an incident began and when it was discovered, rather than assuming the acronym carries its own explanation.
10: Mean time to contain (MTTC) security incidents
MTTC measures the average time to halt the spread of a security incident once it’s been detected. A lower MTTC reflects a faster, more effective incident response function.
Good to know: MTTC gives a more complete picture than MTTD alone, since it captures both detection and the effectiveness of the initial response. CybelAngel’s own investigation into the April 2026 Vercel breach is a useful case to walk a team through when explaining MTTC in practice, since containment there depended on tracing an intrusion back through a third party’s infrastructure, not just Vercel’s own.
11: Mean time to remediate/resolve incidents
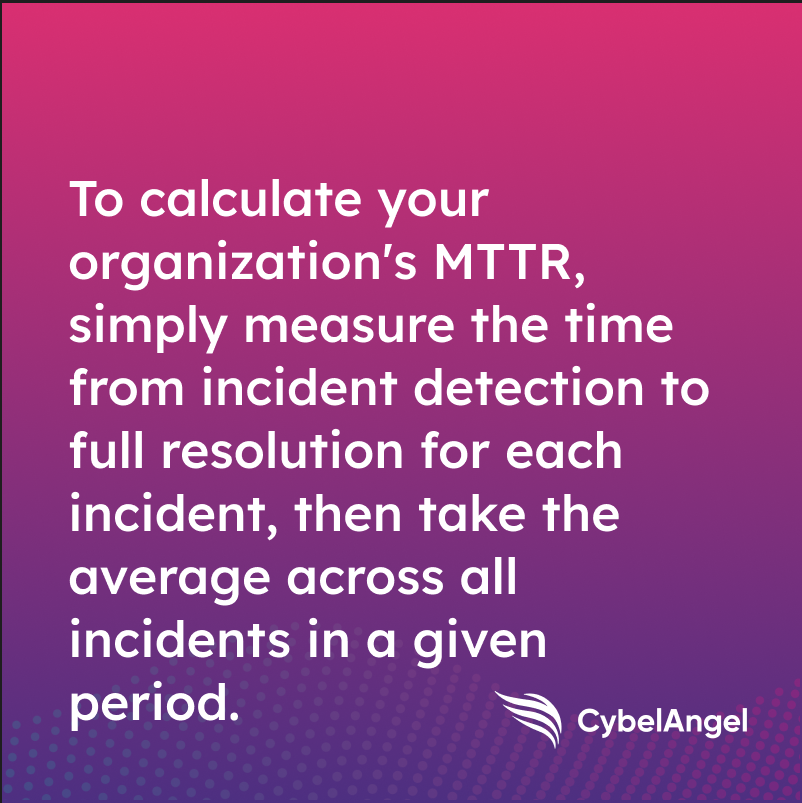
MTTR measures the average time to fully address and resolve a security incident, from detection through completion. A lower MTTR reflects efficient diagnosis, containment, and resolution, and it provides a more complete view than detection time alone since it spans the entire incident lifecycle.
12: Percentage of data centralized
This metric measures how much of an organization’s total data has been consolidated into a central repository from disparate systems and sources. Higher centralization generally means more accessible data and faster decision-making during an incident, when time to locate relevant information matters directly.
13: Percentage of data encrypted
This metric tracks the proportion of organizational data encrypted at rest or in transit. A higher percentage reduces vulnerability to data breaches and unauthorized access, and it’s frequently a direct compliance requirement rather than a discretionary control.
14: Backup frequency and recovery speed
Backup posture remains one of the most direct levers an organization has over ransomware outcomes, and the economics behind it have shifted.
Sophos’s State of Ransomware 2026 report puts average recovery cost per incident at $1.7 million, and separately finds that 79% of ransomware attacks now begin with a compromised identity rather than an exploited vulnerability. Backup frequency and recovery speed are still control points that matter regardless of entry vector, but they’re no longer the whole story. An organization can recover cleanly from an encrypted server and still have the underlying identity compromise that caused it go unaddressed.
Set internal targets for both indicators rather than tracking them qualitatively:
- Backup frequency: daily backups for critical systems, no exceptions
- Recovery speed: a target tied to your Recovery Time Objective (RTO), for example 500 GB/hour
Related viewing
This is the same shift covered in Cyber Trends in 2026: Attackers Don’t Hack Anymore, They Log In, a useful five-minute watch to send to a team still planning backup strategy around exploit-driven ransomware rather than identity-driven ransomware:
15: Percentage of company data exposed on the dark web
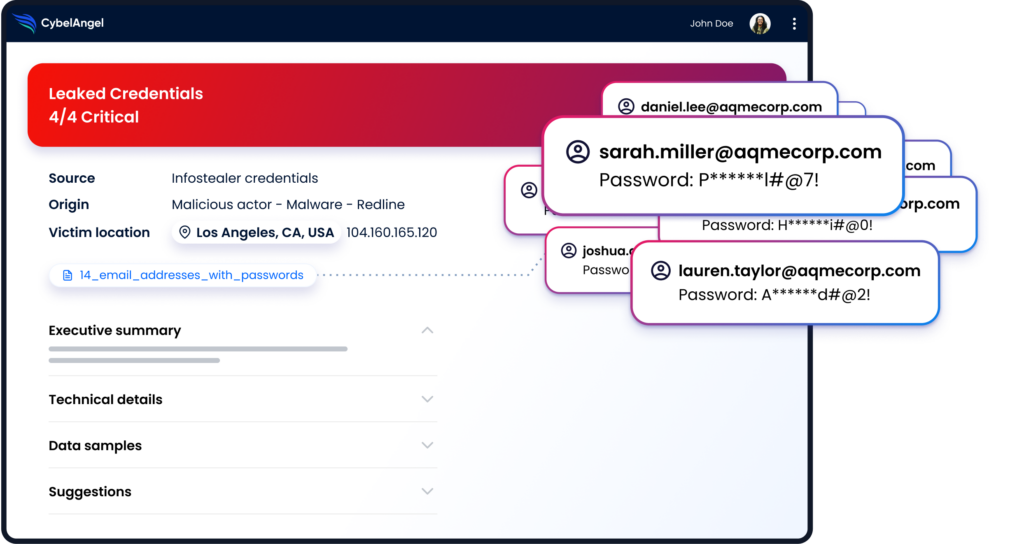
This metric tracks the proportion of an organization’s data found exposed on the dark web, spanning supply chain documentation, leaked internal files, and customer or employee data. CybelAngel’s Dark Web Monitoring service is built to detect and track this category of exposure directly.
16: Number of unidentified devices on the network
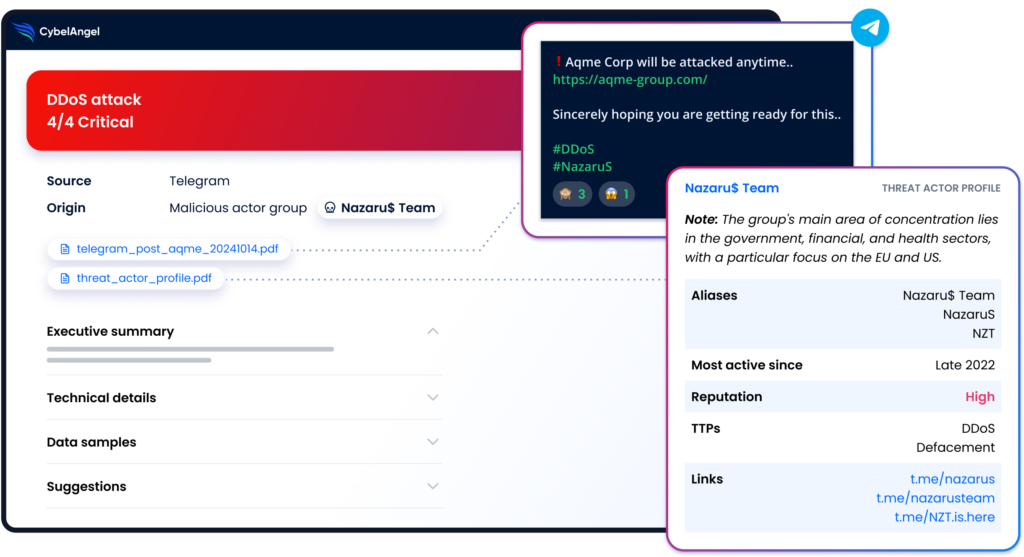
Unidentified devices, personal hardware, unmanaged IoT, and shadow infrastructure, represent unauthorized access points that standard asset inventories routinely miss. This is a metric best tracked through continuous discovery rather than periodic manual review; see our guide on the risks of internet-connected devices for the detail.
17: Number of devices with unpatched software
Timely patching directly reduces attack surface. To track this metric with any rigor:
- Run vulnerability scanning tools across the full environment
- Cross-reference results against known vulnerabilities and available patches
- Track patch levels consistently across every environment in scope
- Monitor the trend line, not just the current snapshot
18: Rate of true positives in security alerts
This metric reflects the accuracy and efficiency of an organization’s detection systems: the ratio of confirmed threats to total alerts generated. When evaluating vendors, ask each one directly how they measure and report this ratio, rather than accepting alert volume as a proxy for coverage.
19: Number of threats detected and prevented by endpoint solutions
This metric assesses how effectively endpoint protection identifies and neutralizes threats. A high detection and prevention rate is the baseline expectation for maintaining both security posture and compliance standing.
20: Results from penetration testing and red team exercises
Simulated attacks reveal response times, downtime, control gaps, and how effectively a team coordinates under pressure. Phishing simulations belong in the same category: an estimated 3.4 billion phishing emails are sent daily worldwide, and Verizon’s 2025 Data Breach Investigations Report found phishing present in 36% of all breaches, still the single most common initial access vector tracked in the report.
Monitoring these results consistently also supports regulatory compliance reporting, since most frameworks now expect documented evidence of testing, not just a policy stating that testing occurs.
21: External security ratings compared to peers
Gartner has noted the growing weight boards place on quantitative security ratings when assessing business relationships and risk. Scores typically range from 0 to 950. For guidance on presenting this and other metrics to a board specifically, see How to Navigate Board Meetings: A Primer for CISOs.
22: Compliance with regulatory requirements
This is a broad metric by necessity, but an essential one. It requires an industry-specific and jurisdiction-specific framework for implementing and maintaining security practices, and reporting on posture without full visibility into compliance status is not a credible position to present to a board or a regulator.
23: Application security testing scores
Application Security Testing (AST) scores surface the highest-risk issues in an organization’s applications, allowing SOC teams to prioritize resources against the areas of greatest exposure rather than spreading effort evenly.
Good to know: AST scores are also a useful, underused input when evaluating vendors and third parties, giving a concrete read on their security posture rather than relying on a questionnaire alone.
24: Volume of actual incidents versus intrusion attempts
A decreasing ratio of actual incidents to intrusion attempts is the target; an increasing ratio signals control gaps worth investigating directly. To track it:
- Log intrusion attempts using IDS, firewalls, and existing security tooling
- Record incidents and their documented impact
- Calculate the ratio: actual incidents divided by total intrusion attempts, for a defined period
- Aggregate through SIEM tooling across all relevant data sources
- Report on a consistent cadence to make trends visible over time
25: Results from tabletop exercises and attack simulations
Tabletop exercises provide tangible evidence of how a team actually responds to high-severity incidents, distinct from how a written playbook describes they should respond. NIST recommends a minimum annual frequency.
Useful resources for structuring these exercises:
26: Percentage of watchlisted (high-risk) users
Tracking the proportion of users flagged as high-risk is a narrow-seeming metric with outsized value. The relevant population typically includes:
- Former employees whose access hasn’t been fully deprovisioned
- Users with suspicious network activity
- Users with access to confidential data
- Users with a documented history of policy violations
27: Level of employee security awareness
Human error remains one of the most consistent variables in breach causation. Measuring and reporting on awareness initiatives, phishing test results in particular, gives a CISO a concrete way to demonstrate progress rather than assuming training is working.
The relevant current data point is not the volume of AI-generated phishing attempts but their effectiveness. IBM’s 2025 findings show that 1 in 6 breaches now involves attacker-used AI, split roughly between AI-assisted phishing lures and deepfake impersonation. That shift changes what awareness training needs to cover, voice and video-based social engineering are no longer edge cases worth a footnote.
28: Frequency of security awareness training
Training cadence should be tiered rather than uniform:
- Annual training: the baseline, mandatory for all employees
- Ad hoc refresher training: tied to seniority and access level
- Situational training: triggered by promotions, role changes, or shifts in the threat environment
- New hire training: NIST recommends completion within the first two months of employment
- Continuous learning: ongoing, given how quickly the threat environment itself changes
29: Depth of network segmentation (e.g. IoT devices)
Network segmentation depth is essential to attack surface reduction, particularly for IoT devices, which are frequently deployed with minimal security review. A practical measurement approach:
- Number of VLANs in place
- Granularity of access controls between segments
- Percentage of IoT devices isolated in dedicated segments
- Frequency of segmentation policy review and update
30: Return on investment (ROI) for cybersecurity initiatives
ROI is the metric most directly tied to securing and retaining budget. Framing specific investments in terms of risk reduction or compliance improvement, rather than general threat prevention, removes friction from the decision-maker’s side of the conversation.
A Forrester Consulting Total Economic Impact study found that CybelAngel customers realize a 359% ROI over three years, with a total NPV of $2.66 million. It remains the most current independently commissioned study of its kind for the platform.
Related viewing
For the board and budget side of this specifically, Rethinking Cybersecurity Strategy 2026: AI, Budgets & CISO Insights covers how CISOs are framing 2026 budget conversations, useful context before your next planning cycle:
31: Bonus tip: the false positive trap
False positives are a genuinely misleading KPI when tracked in isolation, and the scale problem behind them has grown, not shrunk. GitHub alone now hosts over 180 million developers, up from roughly 100 million just two years ago, and the volume of incidental keyword matches referencing any given organization scales with that growth. Historically, roughly 98% of such mentions turn out to be harmless references rather than genuine threats.
Filtering that noise is where a false-positive rate alone becomes actively misleading as a KPI: a team that reports zero false positives by suppressing volume isn’t necessarily safer than one reporting a manageable rate against real coverage. CybelAngel’s own detection has produced an 11% year-over-year rise in true positive alerts specifically because the filtering improved, not because the underlying noise went down. Track the true positive rate against a defined coverage baseline. Retire false positives as a standalone KPI.
FAQs
Fewer than most dashboards suggest. Tracking all 30 common metrics at once tends to produce a report nobody fully reads rather than one that drives decisions. A smaller set, five to eight metrics tied directly to board, budget, or remediation decisions, is more useful than comprehensive coverage of every available KPI.
There’s no single benchmark that applies evenly across industries, but IBM’s 2025 Cost of a Data Breach Report puts the average time to identify and contain a breach at 241 days globally, the fastest the report has recorded in nine years. Treat that figure as a directional ceiling to beat, not a target to meet.
MTTD (mean time to detect) measures the time between an incident occurring and its detection. MTTC (mean time to contain) measures the time from detection to halting the incident’s spread. MTTR (mean time to remediate) measures the full lifecycle from detection through complete resolution. Each captures a different stage, and reporting only one can hide problems in the others.
Cost per incident, risk exposure, and return on investment tend to land best with a board, since all three translate directly into financial terms a board already uses for other risk decisions. Technical metrics like MTTD or patch percentages usually need translation into one of these three before they’re useful in a board setting.
Most commissioned ROI studies, including Forrester’s Total Economic Impact methodology, calculate it by comparing quantified benefits (avoided breach costs, reduced insurance premiums, avoided hiring) against the total cost of the investment over a fixed period, typically three years, expressed as a percentage return and a net present value figure.
The metric that matters is the one that changes something
Every metric above has a legitimate use case. Very few organizations need all 30 in active rotation at once, and a dashboard crowded with metrics nobody acts on is not meaningfully different from having no dashboard at all.
Before adding the next one, it’s worth asking a harder question about the ones already in place: which of these has genuinely changed a resourcing decision, a board conversation, or a remediation priority in the last two quarters. If the honest answer is none of them, the fix isn’t a 31st metric. It’s removing several of the existing ones and reporting a smaller number with enough context attached that the audience can actually act on what they’re seeing.
You can find more on communicating metrics effectively to non-technical stakeholders in The Essential CISO Primer, Second Edition. For the rest of this series, see the CISO Insights archive, including:
- A New CISO’s First 100 Days: The External Threat Audit Checklist
- How to Navigate Board Meetings: A Primer for CISOs
The standard for a KPI health check
Whether distilling metrics for board members or covering more technical ground with a SOC team, four practices hold regardless of audience:
- Use trusted, verifiable data sources, vendor-supplied metrics included
- Automate reminders and reviews for the metrics that are actually in active use
- Test and audit the incident response process itself, not just the metrics describing it
- Share progress regularly enough that the team’s investment in the numbers doesn’t lapse
A smaller set of metrics your organization actually understands and acts on will do more for your security posture than a complete set nobody has time to interpret. If you want a platform-level view of how much of this can run continuously rather than as a periodic reporting exercise, that’s what Attack Surface Management is built to do.
About the author